Kamino Lend Monthly Report - May 2025
 May was a landmark month for Kamino, marked by the launch of Kamino Lend V2 - a modular upgrade that reshapes the credit market ecosystem on Solana. Built on top of Kamino’s battle-tested foundation, V2 introduces permissionless market creation coupled with liquidity allocating vaults, creating a flexible yet capital efficient system designed to scale lending across a wide range of asset types and use cases. This upgrade also unlocks more granular, market-specific risk controls, giving risk managers tighter tools to govern risk, exposure, and to tailor strategies.
The community response was immediate: over $70M was deposited into V2 markets within its first 24 hours both directly from suppliers and from the vault layer.
Protocol-wide growth continued alongside the launch. Supply rose to $3.56B (+3.6%) and debt to $1.49B (+6.4%), supported by both inflows and increased leverage. Borrowers paid a record $9.3M in interest, underscoring continued appetite for credit.
SOL markets remained a key driver, with supply expanding to 6.32M SOL (+333K) and debt to 5.72M SOL (+525K) with rising utilization and rates. In contrast, Kamino Dollar markets saw modest pullbacks, with supplies and borrows dipping slightly.
On top of all of this, Kamino concluded season 3 of its points program, distributing $26M in KMNO to its users. Season 4 kicked off with a new incentives scheme with updated mechanics designed to reward long-term alignment.
Ecosystem momentum accelerated as well, with integrations and partnerships across Steakhouse, Hashflow, Huma, Re7, MEVCapital, and others - all building on top of Kamino’s new architecture.
 Check out the May Monthly Snapshot for full details
1. Overview of Market Performance
Kamino entered May with strong tailwinds from April and ended the month with its most transformative launch to date: Kamino Lend V2. Demand for leverage remained high, with $1.492B in total debt and a record $9.3M in interest paid by borrowers, sustained by stable market conditions and renewed user confidence across Solana DeFi.
Market activity remained steady, demand for leverage continues while new vault-based lending strategies now provide efficiency through the various markets. Protocol revenue grew with borrowers paying $9.3M in interest.
While the Main and Jito markets continued to lead in volume, May marked a clear pivot toward market diversification, with new V2 markets and integrations absorbing liquidity from outside the protocol as well as some existing markets .
Alongside Kamino V2, The team announced several major developments:
- Kamino Lend V2 Launch: Introduced modular lending with automated vaults, margin trading, and RWA support. V2 surpassed $70M in supply and $30M in borrows within 24 hours.
- Season 3 Rewards & Season 4 Preview: Distributed 350M KMNO (~$26M) and announced a shift away from Points-only incentives, with Season 4 set to launch soon.
- Binance Listing: KMNO was listed on Binance, increasing liquidity and global exposure.
- Hashflow Integration: Enabled RFQ-based swaps for better execution and reduced slippage.
- Yala Collaboration: Activated $YU incentives for BTC-backed stablecoin vaults.
- Huma Finance Boost: Offered a 5x reward multiplier for PST deposits, driving 10.5% APY through RWA exposure.
- Technical Upgrades: Shipped multiple SDK updates and completed smart contract audits across the board.
These initiatives reflect Kamino’s accelerating momentum as it scales toward a more flexible, capital-efficient, and integrated DeFi credit layer on Solana.
2. Supply, Borrowing & Revenue Trends
As a whole, Kamino Lend continued its steady expansion in May, with total protocol debt reaching $1.49B (+6.4%) and supply growing to $3.56B (+3.6%), marking a more measured pace after April’s sharp rebound.
The Main Market remained the protocol’s anchor, with supply climbing to $2.54B (+5.8%) and debt to $1.1B (+6.7%). A significant portion of this month’s growth came from Kamino V2 markets, particularly those enabling LST-based leverage strategies.
The Marinade Market led with $70.3M in supply and $33.1M in debt, driven by strong demand for mSOL looping. The Sanctum Market followed with $15.5M supplied and $7M borrowed. The Exponent Market, featuring Principal Tokens as collateral, also saw solid adoption, with $13.6M in supply and $7.8M in debt, with good early traction for fixed-income primitives on Solana.
The Jito Market saw a modest decline as users shifted toward newer V2 vaults offering higher yields and dynamic parameters. The JLP Market continued to contract, likely reflecting lower internal yields and diminished incentive alignment.
On the asset side, inflows centered around new markets: SOL (+$51M), JupSOL (+$34M), cgntSOL, (+$30M), mSOL (+$19.1M), INF (+$8.5M) and PT tokens (+$11.5M). At the same time, cbBTC (–$71.6M), USDC (–$61.4M), and JLP (–$48.9M) experienced notable outflows as users rotated capital into V2 strategies. The growing share of LST loop vaults also contributed to a $81M increase in SOL-denominated debt.
Kamino V2 Markets & Vaults
The launch of Kamino Lend V2 on May 22 marked a fundamental upgrade in Solana’s credit infrastructure. V2 introduced modular lending markets built atop an overarching vault-native architecture—enabling isolated risk management, programmable collateral onboarding, and composable capital strategies.
Read more in our deep dive: Inside Kamino V2
By the end of May, V2 markets had attracted $134M in supply and $53.4M in borrows, despite launching in the final week of the month.
Kamino V2 launched with 10 new isolated markets:
- Marinade (mSOL)
- Sanctum (INF)
- Exponent, using Principal Tokens (PTfragSOL, PTkySOL)
- Solblaze (bSOL)
- Bonk (BONK)
- Fartcoin (FART)
- Jito Restaking (rsjitoSOL)
- Bitcoin (WBTC)
- JTO
- Jupiter (JUP)
These markets range from high-yield LST loops to experimental collateral and restaking strategies, all operating under customized risk profiles.
In parallel, 8 lending vaults were live by month-end, actively deploying capital into the new markets while managing risk and yield profiles across isolated pools:
- USDC Prime by Steakhouse
- AllezSOL
- MEV Capital SOL
- AllezUSDC
- Steakhouse USDG
- MEV Capital USDC
- Re7 SOL
- AllezUSDT
Combined, these vaults had allocated over $40M in liquidity across Kamino’s V2 markets by the end of May, less than two weeks after launching.
V2 sets the foundation for a more modular and scalable lending system on Solana, where credit, incentives, and risk can evolve at the vault level. With new markets and vaults onboarding rapidly, V2 is on track to become the backbone of Kamino’s next growth phase.
3. Kamino Stable Dollar & SOL
May saw continued strength in Kamino’s core markets, with SOL-denominated strategies accelerating and stablecoin markets experiencing modest rebalancing. Utilization remained healthy across both segments, supporting robust protocol revenue.
SOL Markets
SOL markets continued to grow steadily in May:
- SOL supply increased to 6.32M (+333K MoM)
- SOL debt expanded to 5.72M (+525K MoM)
- Utilization rose to 90.6% (+3.8%)
- Borrow rate ticked up to 8.16%, while the supply rate rose to 6.30% lifted by the new market subsidies
This growth was largely driven by continued demand for LST leverage strategies met with increased capacity across both V1 and V2 markets. SOL continues to be the most borrowed asset on Kamino, underscoring its centrality within the protocol.
Kamino Stable Dollar Markets
Stablecoin markets saw a slight contraction in May:
- Kamino Dollar supply decreased by $58M to $665.9M
- Debt dipped by $11.6M to $532.7M
- Utilization remained stable at 80.0% (–0.4%)
- Borrow rate fell to 7.89% (–1.11%)
- Supply rate rose slightly to 4.68% (+0.17%)
- High rate variability driven by lower liquidity stables
The reduction in supply and debt was primarily concentrated in legacy assets like USDC and PYUSD. By contrast, USDG continued growing supported by incentives.
4. Transaction Volume and User Behavior
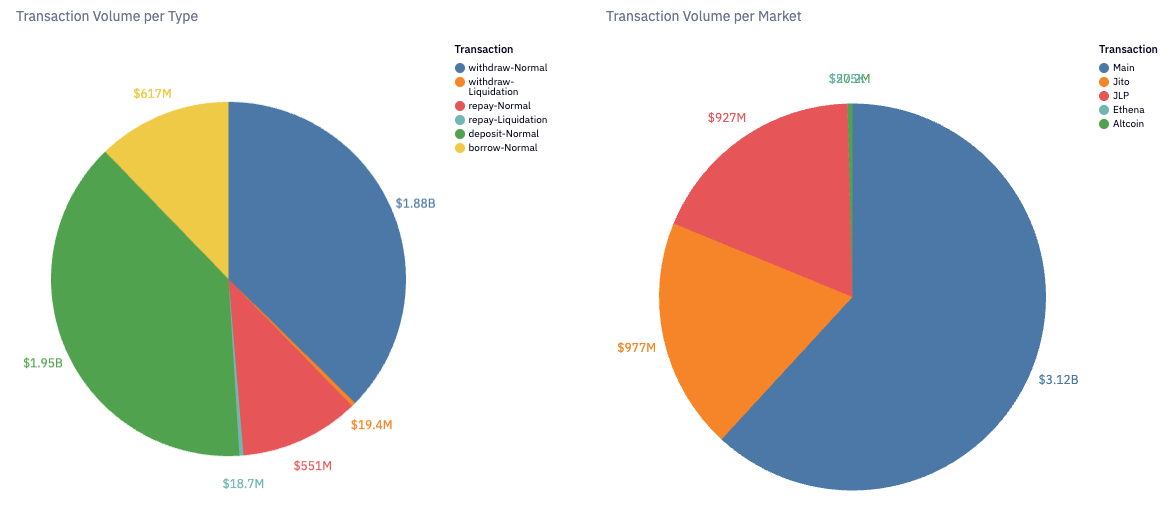
The Main Market remained dominant with 64% of the total volume. The JLP and Jito market show modest decline in market share and in some cases capital migration to newer, more subsidized V2 markets and vaults.
Kamino V2 markets, contributed to late months volume, and are expected to expand further in June:
- Marinade: $239M
- Sanctum: $40.5M
- SolBlaze: $36.1M
- Altcoin: $25.9M
- Exponent: $18.6M
- Bonk: $5.19M
- Bitcoin: $5.06M
- Fartcoin: $1.69M
Borrowers showed increasingly dynamic behavior, repaying in higher volumes and rotating into new vaults and markets. The rise in withdrawals aligns with this shift, as users reallocated capital across the expanding Kamino ecosystem. Notably, liquidation volume dropped sharply thanks to stabilising market prices.
5. Market Movements & Liquidations
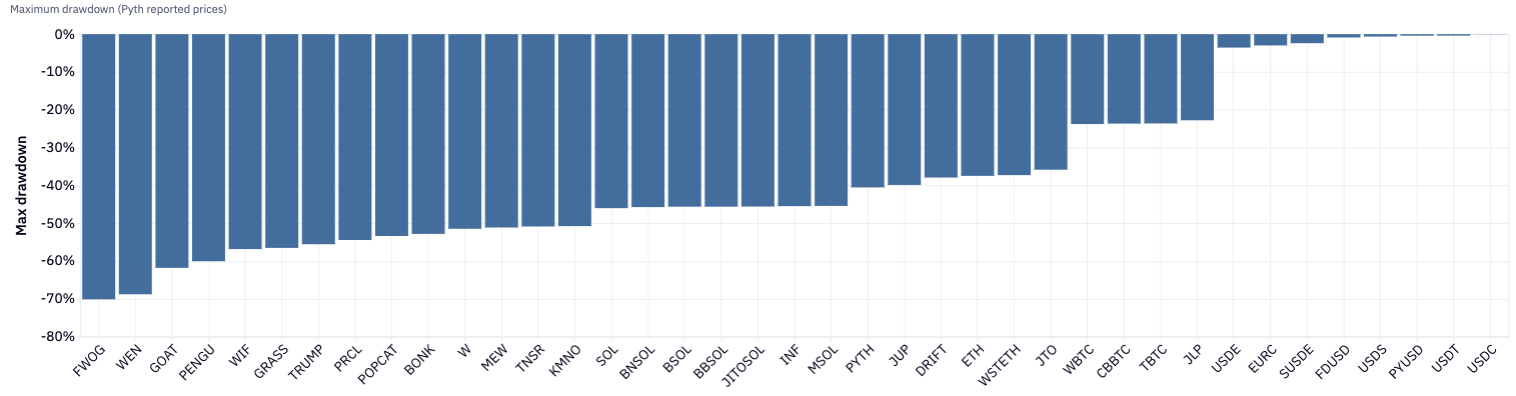
After subdued volatility throughout most of May, liquidation activity remained low and well-distributed, despite several long-tail assets experiencing sharp drawdowns. Core assets such as SOL, JitoSOL, and mSOL saw only moderate drawdowns (10–20%).
Total collateral seized in May amounted to just $1.9M (-88.9% MoM). Activity was concentrated in the Main market, and SOL exposures with SOL and JitoSOL accounting for over $1.5M in collateral seized.
Kamino’s liquidator activity decreased in May, with 39 addresses executing 816 liquidations—down from April in line with lower market stress. Coverage remained efficient and well-distributed, with minimal bonuses and no systemic gaps.
6. Stress Testing
Portfolio risk across Kamino markets remained concentrated but controlled in May. User positions continued to cluster near liquidation thresholds, particularly in JLP, Main, and Altcoin markets, though the overall collateral profile appeared healthier than in prior months.
Over 60% of JLP accounts continue to sit within 30% of their liquidation threshold. By contrast, Altcoin and Main market positions displayed wider collateral margins.
New V2 markets especially those centered around LSTs like Marinade, and PT show narrow distance to liquidations but lower liquidation risk ast these markets benefit from strong correlation between supplied and borrowed assets, limiting net exposure during price swings.
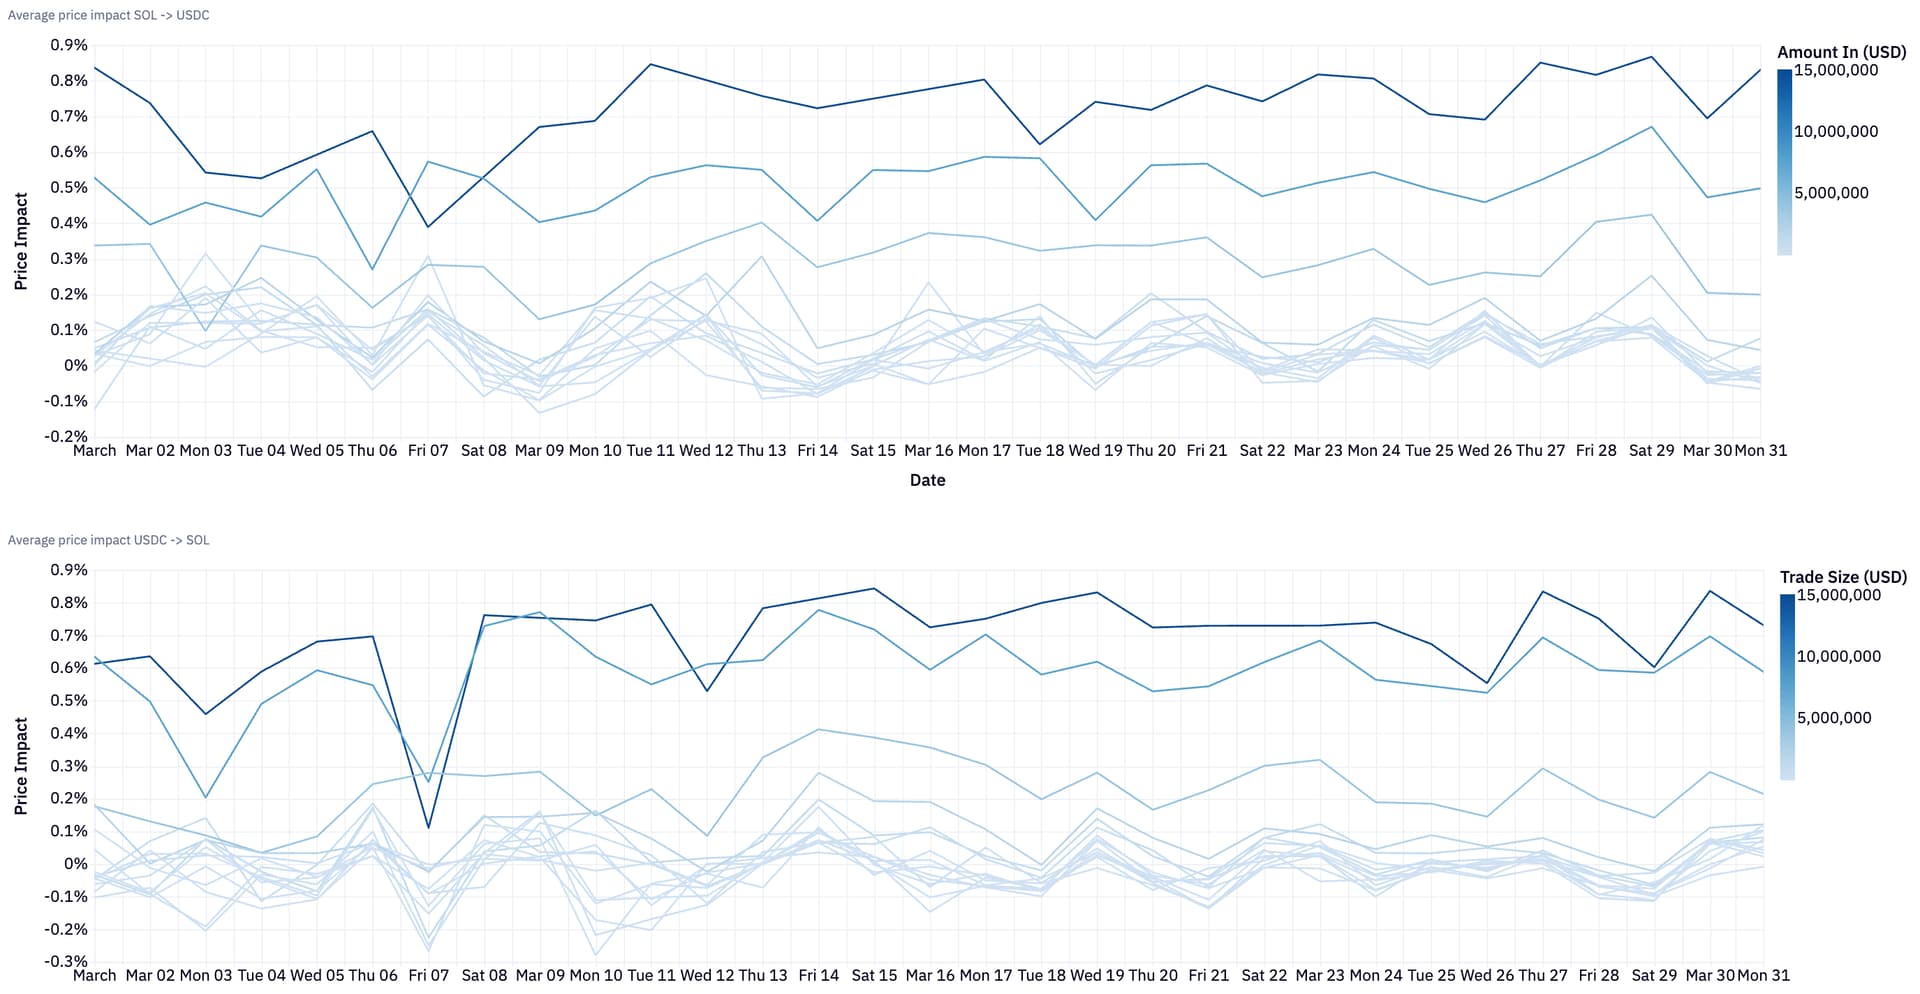
In the event of a market shock, dominant collaterals SOL and JLP would be the first to face liquidation exposure. These assets are also the most liquid and composable on Solana, enabling graceful position unwinding with limited price impact. Trade size analysis shows low slippage and stable price impacts for large sizes across USDC–SOL pairs.
Total Collateral at Risk & Bad Debt Exposure (ceteris paribus):
- Should an instant 30% market drop occur, $177.3M in collateral could be liquidated (-50.5% MoM), potentially resulting in $2.9M in bad debt (-12% MoM)
- In a 60% crash scenario, liquidation exposure rises to $705M (-18.4% MoM), with potential bad debt reaching $90.6M (-36.6% MoM) under absolute worst case scenarios.
Despite steady protocol growth, modeled systemic risk decreased, underscoring the improved borrower behavior as volatility eased across May.
7. Conclusions & Risk Considerations
May was a defining month for Kamino, with Lend V2 catalyzing a shift toward vault-based, modular markets that now underpin the protocol’s architecture. While overall growth was more modest than April, the protocol continued to expand - reaching $3.56B in supply and $1.49B in debt, supported by steady inflows and sustained borrowing demand.
Users exhibited improved risk posture, with wider buffers and reduced proximity to liquidation thresholds. The rise of new V2 markets with their initial focus on LSTs, has allowed for higher LTVs due to the inherent collateral-debt correlations. Simulated bad debt risk fell sharply, down 55% in a 30% market shock scenario, reflecting both market stability and healthier borrowing practices.
Kamino closes May in a strong position — scaling new architecture, deepening integration across the Solana ecosystem, and reinforcing its role as the chain’s leading credit layer.