
The week of February 24th saw heightened volatility in the crypto markets, marked by a sharp price drop early in the week, followed by a strong rebound on Sunday after the U.S. strategic reserve announcement. SOL fell from $170 to a low of $125 before rallying back to approximately $175 by March 2nd.
Despite this volatility, Kamino’s lending markets demonstrated robust performance, facilitating 8,451 liquidations across 2,990 wallets, amounting to $22.1M in collateral liquidated and $21.2M in debt repaid.
This analysis examines protocol metrics, liquidation patterns, and risk management performance during this period of market stress. For an in-depth look, see the February 24th-March 2nd Dashboard.
Market Volatility

The week of February 24th, SOL price experienced significant volatility, crashing from 170$ to a low of approximately $125 on February 28th before recovering sharply to about $175 by March 2nd, representing a 45% price swing within the week. This volatility was reflected across the broader crypto ecosystem, with many tokens experiencing substantial drawdowns before recovering.

According to Pyth oracle data:
- On average, assets on Kamino experienced a maximum drawdown of -22.3%
- The largest drawdowns on Kamino-listed assets were seen in altcoins, with FWOG dropping as much as -46%
- The average return across all crypto assets was -1.14% during this period
Notably, blue-chip assets like SOL and BTC, set to be included in the U.S. strategic reserve, fully recovered and even surpassed their pre-drop levels. Meanwhile most other assets struggled to regain their losses.
User & Market Activity
Transaction Patterns
The protocol recorded $2.5B in total weekly volume, with positive net deposits but a decrease in borrowing. Overall, liquidations represented less than 1.7% of Kamino’s transaction volume.

As expected during times of heightened price volatility, the Kamino protocol saw increased transaction volumes. February 25th processed the highest daily volume of the week, summing to $552m, nearly half of which were withdrawals.

The volume spikes align with periods of significant price movement, indicating users actively managed their positions in response to market conditions.
The sharp price recovery on March 2nd was met with increased deposit activity but relatively modest borrow increases, suggesting users remained cautious despite improving market conditions. This conservative approach following volatility demonstrates a healthy risk culture among protocol users.
Rate Dynamics
Interest rates remained relatively stable, with some temporary spikes. FDUSD saw rates briefly exceed 110% APY, mostly due to the reserves being relatively small and therefore more exposed to large transactions. PYUSD, SOL, and USDe also experienced notable rate increases.

These spikes were short-lived, with rates quickly returning to sustainable levels as markets stabilized. This behavior suggests Kamino’s interest rate model functioned as designed, incentivizing borrowers to deleverage during periods of high volatility and increasing incentives for new capital to enter the system.
Liquidation Analysis
- Total liquidations: 8,451 events
- Wallets affected: 2,990
- Liquidators active: 78
- Collateral seized: $22.1M
- Debt liquidated: $21.2M
- Liquidation Fees: $0.9M (total user losses to liquidators)
Despite the significant price volatility, liquidation volumes totalling $43.3M represented approximately 1.7% of total protocol volume, indicating relatively healthy collateralization levels among users and effective risk management practices.
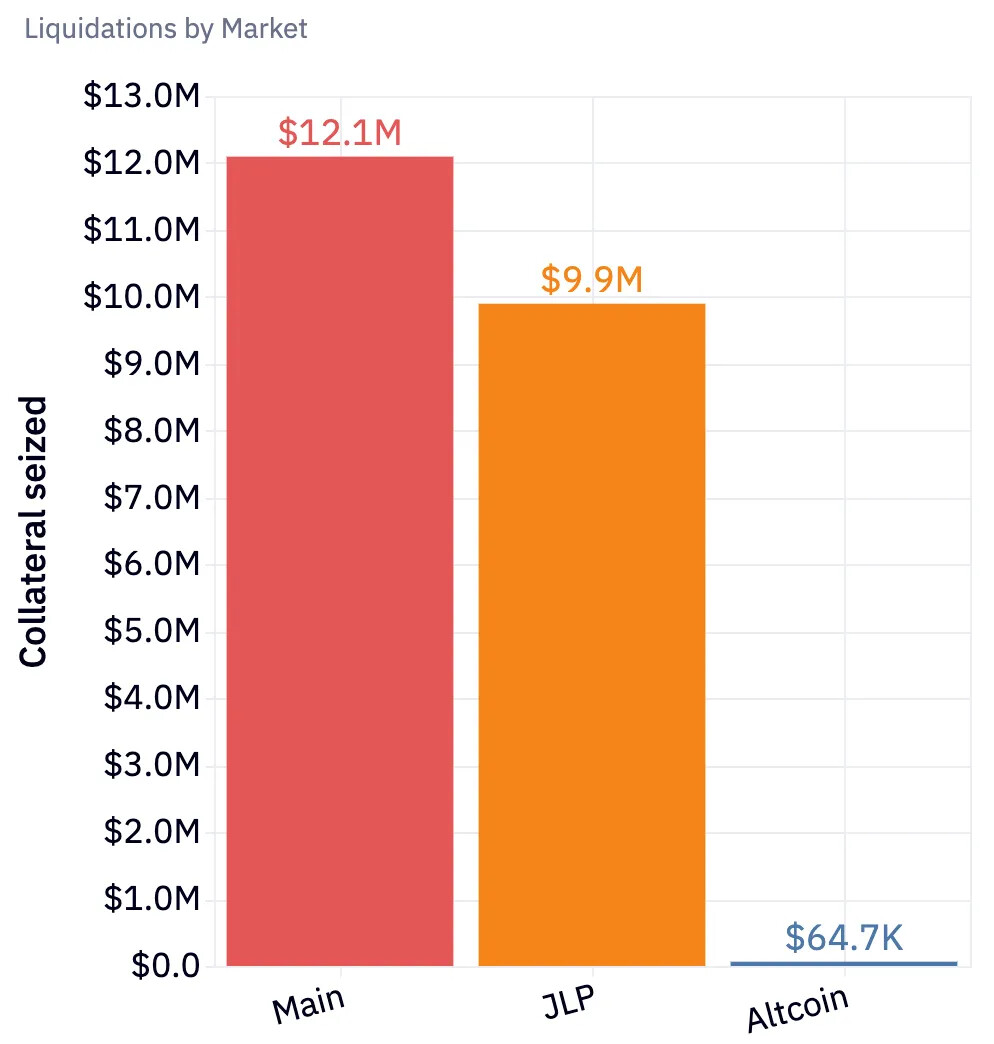
Liquidations were concentrated primarily in the Main and JLP markets:
- The majority of collateral seized was in the Main Market
- The JLP market experienced a significant liquidation volume, about 2% of all JLP market collateral
JLP and SOL were the primary collateral tokens seized, representing 46% and 41% of liquidated collateral respectively, while USDC was the dominant borrowed token being repaid through liquidations, accounting for 70% of the repaid debt based on the charts.
The liquidator landscape showed moderate concentration with top liquidators handling substantial portions of liquidation volume:
- 78 liquidators operated, 3 times more then during previous events
- The most active liquidator processed 25% of the volume from 38 obligations totalling $5.5M in collateral
- The top 9 liquidators accounted for nearly 94% of the collateral seized, with over $1M processed each
- The largest liquidation was $800k of JitoSOL on the main market, followed by a dozen ~ $500k JLP liquidations on the JLP market
The most liquidated owner had $8M of collateral seized across 37 liquidations, only suffering from $180K in liquidation penalties. In total, users only lost $900K to liquidators.
The presence of 78 active liquidators suggests a healthy and competitive liquidation ecosystem, which helps ensure efficient market operation during stress periods.
Jupiter (JLP) Market Analysis
The JLP market warrants special attention as risk parameters were made more aggressive on February 21st, just before this period of market volatility.
- Total deposits: $741M with JLP representing the majority of deposits
- Total borrows: $237M
- Number of positions: 18,357
- Utilization rates reduced with USDC starting at 84% down to 76% at the end of the period
JLP Supply and Debt Dynamics


The JLP market experienced meaningful supply contraction, with:
- Total JLP supply declining from a peak of over $1B in mid-February to approximately $700M by March 2
- Corresponding debt reductions, particularly in USDC, which remains the dominant borrowed asset
The market experienced signification liquidations for the first time with $10m of collateral seized during the week, 97% of collateral seized since the market’s launch.
JLP Collateralization Trends

The collateralization ratio for JLP positions trended down requiring close attention:
- Starting near 200% earlier in February
- Declining to a low of approximately 165% at the peak of market stress
- Recovering slightly to about 180% by March 2nd
This decline in collateralization represents a significant reduction in the safety margin for the protocol, which resulted in significant liquidation volume in this period of high volatility.
JLP Market Risk Implications
The tightened risk parameters implemented on February 21st were tested during this market downturn. While the protocol handled the stress without systemic failure, the declining collateralization ratio suggests users were operating with thinner safety margins than in previous periods. While collateralization experienced a sharp drop to 165%, only about 2% of total collateral was seized, with fast liquidations and no bad debt. This indicates the market was able to process the liquidations effectively and cope with the more aggressive risk appetite of the market.
Final Thoughts
This period of market volatility served as a key stress test for Kamino’s risk management engine, which performed well despite challenging conditions.
JLP Risk Parameter Evaluation: The more aggressive risk parameters set on February 21st have now been tested in market conditions. While the collateralization ratio dropped to 165%, liquidations remained manageable at about 2% of total collateral with no bad debt. This suggests the parameters are finding an appropriate balance between capital efficiency and safety.
Liquidator Ecosystem Development: With liquidator participation tripling to 78 active participants during this event, continued efforts to support and expand this ecosystem would strengthen protocol resilience during future volatility.
In summary, Kamino again successfully navigated significant market turbulence while maintaining system stability. The JLP market’s ability to handle this liquidation event, despite more aggressive parameters, suggests that the updated risk parameterizations are effectively balancing risk and capital efficiency without compromising safety.