November marked a period of strategic recalibration for Kamino Lend users amid broader market volatility. Supply contracted to $3.6B (-19%) and debt declined to $1.3B (-18%), driven by Solana ecosystem deleveraging as SOL experienced a sharp $188 to $134 (-29%) drawdown.
Stablecoin markets remained significant at $1.4B in supply, with emerging players gaining share from legacy stablecoins. The protocol’s liquidation infrastructure proved effective with zero bad debt across 16,228 liquidation events processing $26.5M in collateral through the month.
Strategic progress continued with new PT integrations for fixed-yield strategies, while Season 5 launched with 100M KMNO rewards, including first-time borrower incentives. The vault ecosystem also expanded with the addition of external curator Gauntlet, bringing new vaults to the platform.
1. Overview of Market Performance

November’s performance reflected broader digital asset consolidation, with Kamino contracting across key metrics while maintaining operational excellence.
Kamino closed November with:
- Total Supply: $3.6B (-19%)
- Total Debt: $1.3B (-18%)
- TVL: $2.4B (-20%)
- SOL Price: $134 (-28%)
- Transaction Volume: $31.4B (+41%)
- Interest Paid: $6.2M (-28%)
- Liquidations: 16,228 (+73%)
- Collateral Seized: $26.5M (+4%)
- Distinct Wallets: 111,528 (-1.3%)
The contraction in supply and debt primarily stemmed from two factors: SOL’s drawdown through the month (including a sharp drops on November 1-2 and 19-21) that triggered widespread deleveraging.

Despite these challenging market conditions, several positive indicators emerged. Transaction volume surged 41% to $31.4B, showing continued user engagement and active portfolio management rather than passive withdrawal. The vault ecosystem (detailed in Section 3) expanded strategically with new curator Gauntlet, while new product integrations found early traction.
November’s strategic milestones positioned Kamino for future growth:
- Oracle module upgrade with reliance on both Chainlink and Pyth price feeds
- New collaterals PT-eUSX (Nov 5), PT-USX (Nov 25): Solstice fixed-yield product enabling 5x leveraged loops at ~70% APY, reached $14M PT-eUSX TVL, while PT-USX is promising with 16.5% APY maturing February 9, 2026
- Season 5 Launch (Nov 7): 100M KMNO over three months, first borrower rewards
- Gauntlet Curator Partnership (Nov 12): New SOL and USDC vaults
2. Supply & Borrowing Trends
Liquidity reallocated across Kamino’s market ecosystem, with users moving from volatile asset leverage toward structured yield products and institutional credit markets while the protocol absorbed ecosystem-wide deleveraging pressures.
Market-level trends:
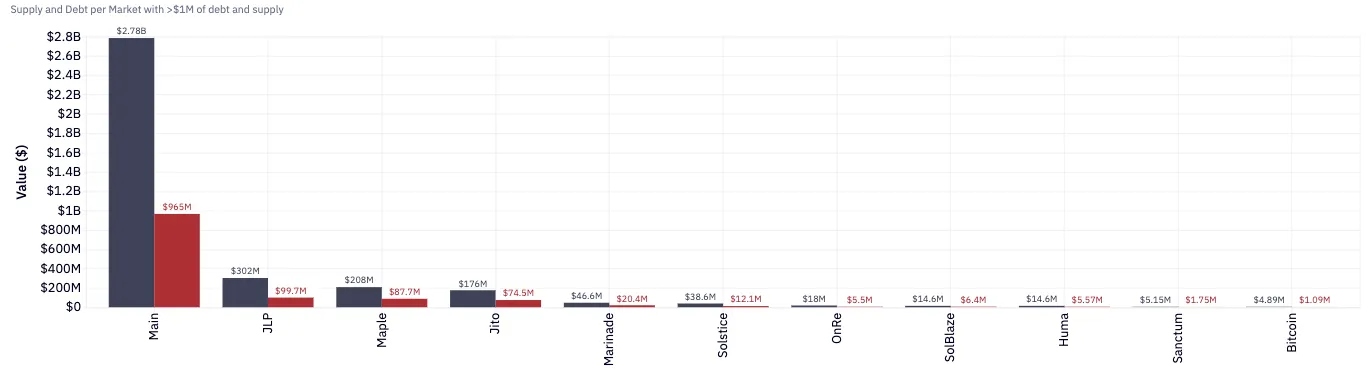
The Main Market continued to dominate with $2.8B in supply (77% of protocol total), serving as the liquidity anchor. While most major markets experienced outflows consistent with broader DeFi deleveraging trends, some grew:
- Maple counter-trend growth: Institutional credit market with +27% supply growth to $208M, driven by syrupUSDC cap increase and high utilization showing strong product-market fit
- Solstice rapid expansion: New fixed-yield market more than doubled to $28.6M (+185%) following PT-eUSX and PT-USX integrations, confirming appetite for structured products
- JLP contraction: Jupiter LP market declined 23% to $302M as leveraged trading activity moderated
- LST market compression: Jito (-29%), Marinade (-56%), and SolBlaze (-55%) all experienced significant outflows as users de-risked correlated positions
- RWA steady performance: OnRe (+24%) showed growth while Huma remained stable at $15M
Asset-level trends:

Major inflows showed user preference for emerging stablecoin alternatives and structured products:
- PYUSD: +$66M - Continued PayPal USD adoption momentum
- CASH: +$37M - phantom’s stablecoin showing rapid adoption
- syrupUSDC: +$24M - Institutional credit growth following cap increase
- PT-eUSX: +$14M - Fixed-yield product launch traction
- cgntSOL: +$15M - Diversified LST exposure
- cbBTC: +$18M - Tokenized Bitcoin continued demand
Major outflows reflected deleveraging and competitive pressures:
- USDC: -$216M - Reallocation to higher-yielding alternatives
- SOL: -$62M - Native SOL deleveraging
- JupSOL: -$26M - Migration to native JupLend ecosystem
- JLP: -$26M - Reduced perpetual competitiveness
- JitoSOL: -$33M - LST consolidation

On the debt side, stablecoin borrowing patterns diverged:
- PYUSD Debt: +$89M - Strong borrowing demand
- CASH Debt: +$28M - Early adoption showing healthy 80%+ utilization
- USX Debt: +$8M - Fixed-yield strategy
- USDC Debt: -$148M - Reduced leverage amid volatility
- SOL Debt: -$49M - Some position unwinding
The November data confirms an ongoing structural rotation: stablecoin supply maintained its 39% protocol share ($1.4B) while SOL declined slightly to 16% ($574M). This shift reflects prices, user positioning to protect from volatility and growing structured product opportunities.
3. Kamino V2 Vaults
Kamino’s Lending Vault ecosystem continued expansion in November, generating $8M+ in cumulative user yields across 17 actively managed vaults curated by 8 professional managers including new entrant Gauntlet.
Vault ecosystem performance:
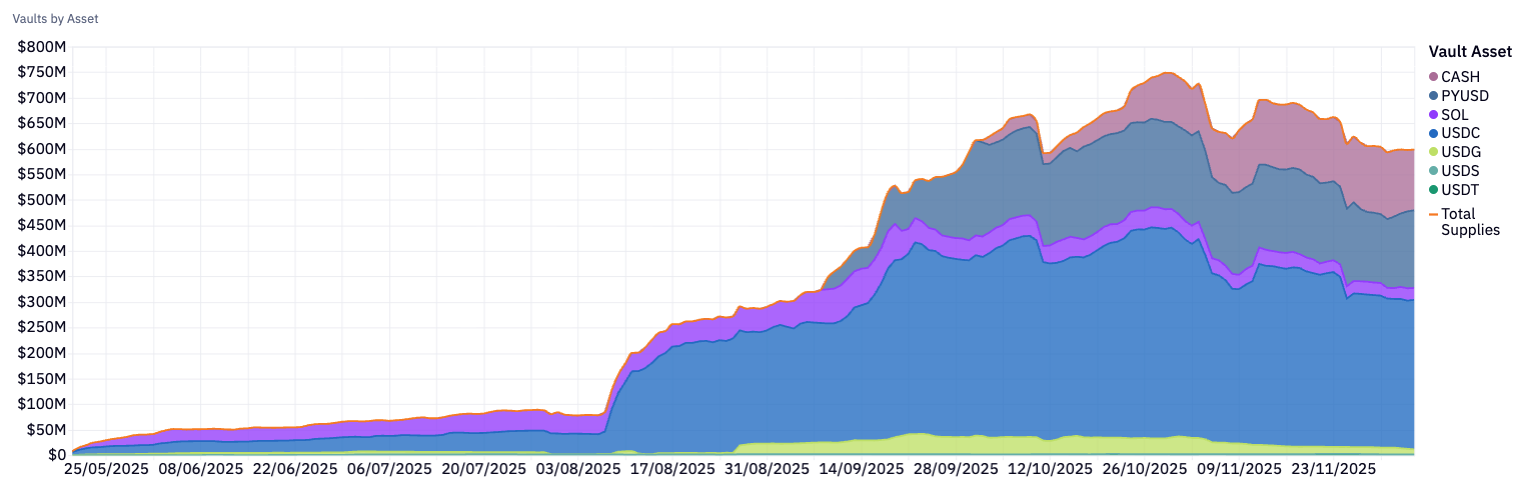
Vault TVL contracted 18% to $604M in line with broader protocol trends, yet maintained a critical 17% share of total protocol supply. This shows vaults’ resilience as a distribution channel even during challenging market conditions. The vault layer added 3 new strategies and ~700 net new depositors, bringing the total active user base to approximately 8,500.
Top vaults by TVL:
- USDC Prime: $210M (-31%) by Steakhouse - Core Markets USDC lending
- Sentora PYUSD: $178M (-25%) - Core Markets PYUSD lending offering competitive returns
- CASH Earn: $130M (+34%) by Gauntlet - CASH lending across markets, only major vault showing growth also with the highest APY
- Allez USDC: $38M (-41%) - Multi-market diversification strategy across 9 lending markets
- Allez SOL: $10M (stable) - SOL/LST balanced exposure growing in nominal terms
Vault diversification:
Vaults continue providing critical protocol diversification across three dimensions. Asset diversity spans USDC vaults ($292M, 48%), PYUSD vaults ($135M, 22%), CASH vaults ($130M, 21%) and SOL/LST vaults ($20M+).
Market allocation actively diversifies beyond the Main Market (77% of protocol supply) into JLP, Jito, Maple, and 15+ specialized V2 markets. Yield sources tap fundamentally different return drivers including pure lending spreads, leveraged trading fees, LST staking yields, institutional/RWA credit, and protocol incentives.
This structural diversity provides resilience against single-source yield compression, with professional curators actively rebalancing across markets as opportunities shift. Gauntlet’s November entry brings additional expertise, expanding the curator ecosystem to 8 managers with differentiated strategies competing for depositor capital.
4. Stablecoin & SOL Markets
November reinforced the structural shift toward stablecoin dominance while SOL markets absorbed volatility-driven deleveraging. Stablecoin supply maintained $1.4B (39% of total) while SOL declined to $574M (16%), marking continued divergence in user preference between stable yield and volatile collateral strategies.
Stablecoin Markets
Stablecoin markets experienced net outflows of $96M (-6.6%) but showed signs of compositional maturation:
- Kamino Dollar supply: $1.36B (-6.6%)
- Kamino Dollar debt: $797M (-5.4%)
- Utilization: 58.6% (+0.7%)
- Supply rate: 2.75% (-9.2%)
- Borrow rate: 5.40% (-10.2%)


Slight utilization and rate compression as competitive pressures intensified across DeFi lending markets. Short term rate volatility continues suffering from whale-driven rebalancing spikes.

At the market level, the Main Market dominated with $1.07B stablecoin supply (-8%) and $585M debt (-6%), maintaining 55% utilization. Maple stablecoins grew 101M (+33%), driven by institutional credit demand. Solstice stablecoin more than doubled to $13.3M (+135%) with 93% utilization, confirming structured product appetite. JLP stablecoin supply consolidated 18% to $127M as leveraged trading moderated, while smaller RWA markets showed mixed performance.


At the asset level, stablecoin composition continued diversifying:
- USDC: $564M supply (-$208M), $496M debt (-$148M) - Declining dominance at 41% share as users rotated to higher-yielding alternatives
- PYUSD: $528M supply (+$85M), $119M debt (+$88M) - significant growth reaching 39% market share, and closing up on USDC
- CASH: $140M supply (+$32M), $115M debt (+$23M) - New entrant achieving 80% utilization, validating product-market fit
- USX: $14M supply (+$5M), $12M debt (+$8M) - Solstice fixed-yield traction with 92% utilization
- USDG: $40M supply (-$10M), $32M debt (-$9M) - Modest contraction as attention shifted elsewhere
November confirmed ongoing rebalancing toward emerging stablecoin players and complex products. USDC’s market share erosion from traditional dominance toward PYUSD and CASH demonstrates users seeking higher yields and diversification. Meanwhile, Maple’s institutional syrupUSDC product and Solstice’s fixed-yield USX tokens carved out specialized niches with complexity premiums.
SOL Markets

SOL markets experienced some deleveraging as volatility continues:
- SOL supply: 4.3M SOL (-10%), $655M (-19% USD terms)
- SOL debt: 3.5M SOL (-10%), $528M (-18% USD terms)
- Utilization: 80.8% (+0.2%, stable)
- Supply rate: 4.3% (+4%)
- Borrow rate: 6.2% (+4%)

The Main Market absorbed most SOL outflows with 3.4M SOL supply (-12%) while maintaining 83% utilization, indicating sustained borrowing demand despite deleveraging. Jito LST consolidated modestly to 651K SOL (-2%), benefiting from its role as primary liquid staking venue.
Smaller LST markets experienced sharper compression: Marinade (-43% to 162K SOL), SolBlaze (-40% to 50K SOL), and Sanctum (-33% to 14K SOL) as users consolidated toward larger, more liquid LST positions.

SOL rates showed modest increases during November:
- Borrow rates rose from 5.94% to 6.17% (+3.9%)
- Supply rates increased from 4.09% to 4.25% (+3.9%)
- Utilization remained stable around 80-81%
- Regular spikes occur, driven by large whale withdrawals over the course of hours
The parallel rate increases despite deleveraging suggest sustained borrowing demand, sustained by Season 5 incentives making SOL-collateralized USDC borrowing attractive.
5. Transaction Volume and User Behavior

Month after month, the transaction activity is growing now at $31.4B in volume (+41% versus October) though the user base remained relatively stable. We observed increased activity from existing sophisticated participants rather than retail expansion, with volume concentrated among power users.
Volume breakdown by transaction type:
- Deposits: $15.8B (+42%) - Strong inflows despite market stress, indicating active position management
- Withdrawals: $13.9B (+54%) - Elevated reallocation activity and defensive positioning
- Borrows: $913M (-37%) - Significant decline reflecting reduced leverage appetite
- Repays: $654M (-17%) - Moderate deleveraging compared to withdrawal pace
- Liquidations: $52.5M (+3%) - Stable in dollar terms despite 73% increase in event count (includes both repays and withdrawals)
The deposit-to-withdrawal ratio of 1.14:1 suggests overall portfolio rebalancing rather than net position building. Users actively rotated between markets and asset types while maintaining protocol engagement. The sharp 37% decline in new borrows combined with elevated withdrawals confirms net deleveraging consistent with risk-off market sentiment.
User metrics showed concentration dynamics:
- Unique active wallets: 12,277 (+0.7%) - Minimal growth indicating mature user base
- Total transactions: 106,406 - High activity driving volume surge
- Average transactions per wallet: 8.67 - Elevated frequency suggesting reactive user base
- Active positions (EoM): 128,258 (-2.0%) - Modest consolidation as users closed marginal positions
The combination of surging volume (+41%) with flat wallet growth (+0.7%) demonstrates sophisticated whales driving activity. Two dominant entities continue to dominate November transaction volume, reinforcing concentration risk a need for continued monitoring.
6. Market Movements & Liquidations
November experienced significant liquidation activity with 16,228 events processing $26.5M in collateral, representing a 73% increase in event count from October with stable volume.

Liquidation summary:
- Total events: 16,228 (+73%)
- Collateral seized: $26.5M (+4%)
- Debt repaid: $26M (+4.5%)
- Unique obligations liquidated: 2,976 (+57%)
- Unique liquidators: 166 (+44%)
- Average liquidation size: $1,631 (-40%)
- Avg liquidation bonus SOL: 1%
- Avg liquidation bonus: 1.34%
- Median liquidation bonus: 1%
- Liquidation penalty as a share of position: 0.09%
The sharp increase in liquidation events with minimal collateral value growth reflects Kamino’s progressive liquidation design. Average liquidation size fell 40% to $1,631, showing the protocol’s ability to liquidate positions incrementally. The expanding liquidator network with 166 unique participants (+44%) indicated healthy competition and sufficient incentives attracting diverse participants.
Most critically, zero bad debt generation despite elevated stress validated LTV ratios and liquidation bonus structures. All 16,228 events processed cleanly with liquidation bonuses averaging just 0.08% of position size with minimal user losses.
Collateral liquidated by asset:
- SOL: $16.5M (62% of total) across 9,634 events averaging $1,715 - Widespread but smooth liquidations
- JLP: $4M (15%) across 2,733 events - While perp lp tokens are diversified among top collateral, they remain exposed to volatility
- JITOSOL: $2.3M (9%) across 492 events averaging $4,711 - Larger positions reflecting institutional user profile
- cbBTC: $1.1M (4%) across 896 events
- MSOL: $551K (2%) across 183 events
- xBTC: $530K (2%) across 266 events
- ALP: $401K (1.5%) across 437 events - ALP announced entering maintenance mode this month. As a result the market is getting depreciated soon to enter auto deleverage
- FARTCOIN: $395K (1.5%) across 197 events - Memecoin volatility caused liquidations
- Other assets: $2.6M across remaining collateral types
The positions liquidated were long positions, with stable debt. SOL’s 62% liquidation share and 59% of events confirms its role as primary protocol collateral. The widespread distribution across 9,634 events rather than concentrated large liquidations indicates healthy risk distribution.
7. Stress Testing
Portfolio risk across Kamino markets remained well-managed in November despite increased liquidation activity. Conservative LTV ratios continue providing substantial cushion against market volatility.
LST-focused markets naturally display tighter liquidation margins due to correlated collateral-debt pairs but maintain resilience through high asset quality and reduced volatility versus SOL. Markets with yielding stable collateral like Maple and OnRe benefit from minimal price risk, having never experienced liquidation events despite higher theoretical LTVs.

In stress scenarios, dominant collaterals such as SOL, JITOSOL, JupSOL, and JLP would carry the greatest liquidation exposure. However, these assets remain highly liquid on Solana with deep liquidity enabling orderly liquidations.

Stress test scenarios instantaneous shock:
-
-10% drop: $50M collateral at risk, no potential bad debt
November’s real-world 14% SOL daily drawdown led to ten times less liquidations than the projected $50M of the -10% shock scenario.
-
-20% drop: $137M collateral at risk, $2.3M potential bad debt (0.18% of total debt)
November’s real-world 23% SOL 48h max drawdown led to 8% of projected liquidations of the -20% shock scenario.
-
-30% drop: $275M collateral at risk, $11.6M potential bad debt (0.89% of total debt)
-
-40% drop: $419M collateral at risk, $32.6M potential bad debt (2.51% of total debt)
-
-60% drop: $845M collateral at risk, $119M potential bad debt (9.16% of total debt)
Liquidator network health:
- Active liquidators: 166 unique addresses +44% growth
- Largest liquidator share: ~15% healthy competition
- Top 5 share: ~48% reasonable concentration
The expanding liquidator network with reduced concentration indicates healthy ecosystem dynamics. Sufficient incentives attract diverse participants without excessive protocol costs, with the largest actor at a reasonable 15% share.
8. Conclusions & Risk Considerations
Kamino closed November having successfully navigated challenging market conditions. Supply contracted to $3.6B and debt to $1.3B, reflecting ecosystem-wide deleveraging as SOL’s 35% max drawdown drove measured position unwinding.
Liquidation systems processed 16,228 events with zero bad debt, validating risk parameters and infra. The vault ecosystem expanded to 17 strategies with Gauntlet joining as curator, solidifying vaults’ 17% protocol supply share. Stablecoin markets held $1.4B supply with PYUSD and CASH gaining share, while new products like PT-eUSX and syrupUSDC found adoption .
Concentration persists with few dominant wallets representing a large share of transaction volume, though large movers are inherent to institutional DeFi. New products like PT-tokens and emerging RWAs require monitoring as markets scale.
November ongoing volatility continues to validate infrastructure resilience - processing 6,700+ liquidations on peak day without bad debt. As year-end approaches, Kamino’s foundation of efficient risk systems, expanding vault ecosystem, and product innovation positions it resilient to market conditions and ready for sustainable growth.
This report represents independent risk analysis by Allez Labs for the Kamino Finance community. Analysis reflects protocol performance through November 2025.
Prepared by: Allez Labs Risk Team
Report Date: December 8, 2025
Next Report: December 2025 Monthly Report published in January 2026